
Deconstructing the 10-K: Part I of II

“147 pages?! You’ve got to be kidding me…” – Warren Buffet, when opening his morning 10-K. Before you take to google (or maybe ChatGPT) to see whether this is a true statement, I will spare you the time—it is most definitely not. In fact, the beloved investor-mogul claims to read 500 pages each day; many of which happen to be within a Form 10-K, doing so to inform his position on any particular business or industry that bears relevance to his multi-billion-dollar portfolio of equity positions and various other securities. Maybe you had hoped there would be some list of obscure and reticent methodologies that separate the Buffets of the world from the likes of mortals such as you or I. The harsh reality: the haut monde aristocrats of the business community simply relish the opportunity to dissect companies through their reporting.
This editorial, from Senior Editor Benjamin Kavanagh, is intended to provide an entry-level probe into corporate & financial statement analysis (specifically the Form 10-K, filed with the SEC of the U.S.) and offers a framework that aims to give relief from the laboriousness’ of reading copious amounts of seemingly boilerplate text—in what is usually a small window of time. This skill should not be understated; as many alumni of the Smith School of Business Alumni and broader Queen’s community can attest to—inevitably you will find yourself getting “deep in the weeds” studying a variety of publicly-traded companies in the youth of your career—therefore, it would be most wise to equip yourself with a toolkit such that you can slash your way through all that undergrowth authoritatively.
What is a Form 10-K?
A Form 10-K is an annual report that publicly traded corporations in the United States are required to file with the Securities and Exchange Commission (SEC). The 10-K offers an all-encompassing summary of the company's financial performance and operations throughout the previous fiscal year. The report contains critical information that assists investors, analysts, and the general public in assessing the company's financial health, dangers, and prospects.
It is part of the company's regulatory obligations to maintain a level of transparency and accountability to its shareholders and the broader public through this document. Now, if you were to take each 10-K you have ever read at face value, you would probably feel the urge to construct the world’s largest long-only portfolio. This is a mistake. Why? Because being selective is what generates outperformance. The key is to, slowly through repetition, develop a contrarian lens whereby you can scrutinize these companies for their overblown future prospects, or side-step the jargon-heavy text, and in many cases, strip down to the source of truth of manipulated financial metrics. This is a balancing act, and it requires critical thinking, pattern recognition, and healthy skepticism at every stage.
Where Can I Find One?
The first step of this anatomic craft is straightforward; there are two simple ways to access a companies’ Form 10-K, i) Using the SEC’s EDGAR Database and searching up the name or ticker of your desired company, or ii) going directly to the 'Investor Relations' tab located on the website of your company. For our veterans, BamSEC, Pitchbook, or any preferred research tool are fair game as well.

Exhibit I: Apple (NYSE: AAPL) Investor Relations Portal
Warmup & Route Planning
Let’s discuss the art of navigating the 10-K as if you were running a 10-K. Not sure which one sounds worse.
Your first step should be to not open the 10-K. While the consequences aren’t necessarily dire, it is always best practice to stretch your legs before. In this case, opening up the quarterly Investor Presentation (“IP Deck”) is your equivalent. This presentation, typically prepared by the Investor Relations group, allows you to warm up to the contents of the business model, recent performance by segment, and the general rhetoric that management is trying to push onto investors. Not only is this more easily digestible than a 10-K at the onset, it will support your ongoing analysis, acting as your ‘route mapper’ as you run through the document. See below an example of what you could discover in Meta’s Q1’23 IP Deck. This should be used only as an aid in your process, and if too heavily relied on, will lead investors down a path toward confirmation bias—typically no good for returns.
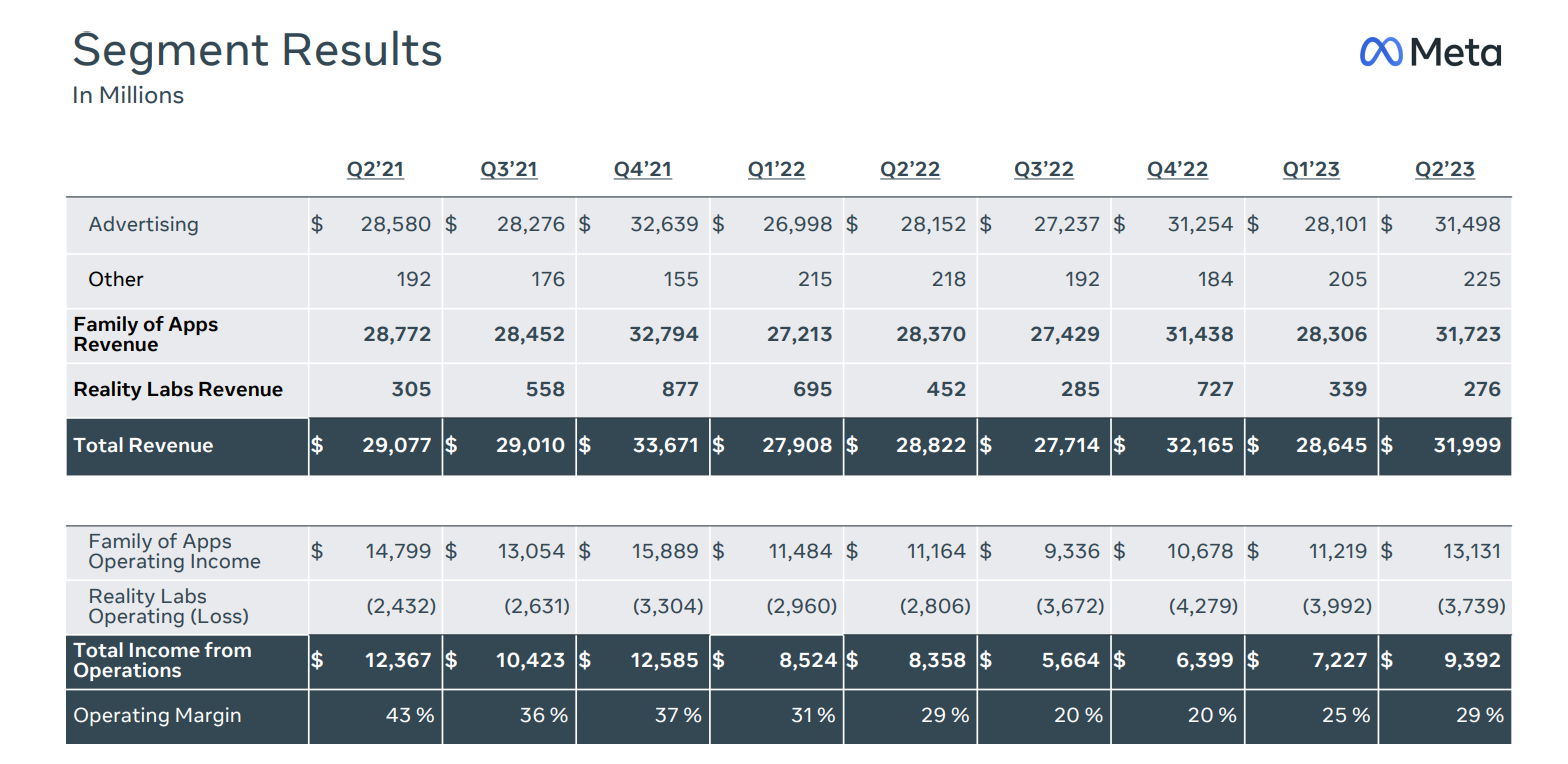
Exhibit II: Meta, Inc. (NASDAQ: META) Investor Presentation
Left Foot, Right Foot, Left Foot...
Now you’ve hit the road. Keeping in mind that energy preservation and efficiency are key, you can begin to embark on this ‘optimized route’—consciously avoiding potholes, and never-ending red lights.
Business description
Item one of virtually any Form 10-K will be populated with a ‘Business Description’ section; whose importance should not be understated. A great mentor to me once said; don’t just know the business, be unable to forget it—a worthwhile turn of phrase that should serve as a sense check before you decide to move on from the overview. A simple way to glide through this section while ensuring a competent understanding of the business model is to note down a position on the following questions;
What is the Cash Cow? – This section allows the reader to uncover which segment of the business has been a recurring source of topline stability. Typically, this business unit can be characterized by a slow-but-steady growth profile, and nothing outside of maintenance Capex or other baseline investments flowing in. The best way to verify you’ve found a cash cow is to skim through a few previous 10-K’s to ensure there’s ample precedent for these claims. For example, Apple’s iPhone has represented ~50 per cent of the company’s revenue share by product for the past 13 years. While it would be unwise to underpin your estimates for this segment on an aggressive growth tangent, you can reliably forecast that it will retain a robust revenue share bearing semblance to the historical pattern. In essence, this is the companies’ crown jewel—the key driver of the businesses’ historical success, and if true to form, this is a fact that is not subject to change in the near future.
What is generating growth? — While in contrast with the previous theme, understanding the source of the company’s growth (or lack thereof) is essential in forming a compelling investment recommendation. A stable cash cow growing at two per cent per annum might be great for shareholders who bought in 15 years ago, but it hardly justifies a compelling case for investment now. Dig into your segmented information and see which product/service has been cannibalizing into the revenue share, and the velocity at which it is accomplishing this. Knowing this will surely help you bring form to the trajectory of the overall business or give you an idea of its remaining lifespan—if the cash cow is dwindling away.
What are the risks to these? – The risks to the business, outlined in Section 1A, will direct you toward the pain points of the aforementioned segments. Most of the text will be relatively boilerplate; nonetheless, there will be a handful of notable risk that are worthwhile to keep in mind as you probe the financials. You can glance over the standardized litigation and macroeconomic conditions clauses, but anything that could materially protrude into the growth engine of the business model is definitely worth your time and consideration.
In parallel to this, developing a thesis on the historical progression of the business up to its most recent reportable period is critical in verifying a realistic outlook for its forward-looking prospects. This understanding can be pulled from the Business History section in the form, as well as some external desktop research. In a distilled sense, you want to know how management views their evolution, and where they currently place their importance. This should help frame your analysis significantly.
Management Discussion and Analysis
The Management Discussion & Analysis (“MD&A”) section offers an informative narrative and analyzes the company's financial results and general performance during the reporting period. It goes beyond the plain financial data, assisting investors in comprehending the reasons for the numbers as well as the company's underlying business strategies. Aside from this, the MD&A section is also where you can gauge the severity of the risks outlined in Section 1A, and better conceptualize forward-looking plans for allocation of capital, and broader strategic direction. It is not uncommon for this section to be a way for the company to explain away their failures, or to pump a successful plan. While this section generally varies by company, the key things to look for in becoming acquainted with the way the business operates are 1) the important operating metrics that management uses to gauge performance, 2) any non-GAAP accounting that you might otherwise come across in an earnings release and be confused by, and 3) understanding the business's cash position and seeing where any cash burn might be coming from.
Best practices to supplement this section would be to review the Management Information Circular Form, containing everything you need to know regarding governance and compensation. Why is that helpful you may ask? Well, it gives you the chance to skeptically assess whether or not your management team is properly aligned with the interests of the company and its shareholders. You can do so by assessing the verity of their key performance indicator’s which are linked to compensation, board-level governance, and uncovering what proportion of their outstanding shares are insider-owned. A simple sense check to determine whether or not we're dealing with a quality management team; I) are they skilled operators, II) do they have capital allocation expertise, and III) do they have industry-leading vision? If the managers in question hold any two of these three traits, herein lies a desirable steward of your capital.
Runners’ High
There’s a certain euphoria that possesses a runner once they hit the proverbial 5-mile marker; where the wind is in your back, and the hills all tilt downward, and your Garmin tells you that you are tracking ahead of PR pace. In theory, your deep understanding of both the business model and the management team should leave you feeling the wind in your back as you approach the next section of the 10-K; Financial Statements & Notes—a category so colossal that its’ anatomy warrants an article of its own.
To be continued in Part II…